Review of Kangaroo data for commercially exploited species 1980-2025 (all government sources)
Life on land

Your support will assist us to continue our research and content development, the greater our resources, the more we can do.
The more we have an accurate understanding of what is happening to nature, the more we can all do to protect what remains of our living planet.
This is also an opportunity for philanthropists to be part of an ongoing project that tells independent stories about the natural world, stories that will help us to better understand what is happening to species and places on our precious planet Earth.
Note: Creative Cowboy Films does NOT have tax deductible charity status.
Becoming a member of Creative cowboy films The Nature Knowledge Channel is a very real way you can help the precious natural world and support the work we do in creating knowledge about what is happening to it.
The Nature Knowledge Channel is a very real way you can help the precious natural world and support the work we do in creating knowledge about the natural world.
Annual membership of the Creative cowboy films - Nature Knowledge Channel gives you full access to content, stories and films, available on this website. Becoming a member of the Creative cowboy films - Nature Knowledge Channel is a very real way you can help the natural world and support our work in creating a greater understanding about what is happening to it.
A point of difference
Creative cowboy films is independent, is not funded by governments or industry, and is not influenced by their associated interest groups. For reasons of independent research and content development, Creative cowboy films does NOT have tax deductible charity status.
Life on land
Updated 11 June 2025
This analysis is a rebuild of annual Kangaroo population estimates, commercial quotas and actual take from 1980, including the data removed from the public gaze.
Between 2011 and 2014 the four state governments of Queensland, New South Wales, South Australia and Western Australia, claimed that Kangaroo populations had risen from 25,158,026 to 53,198,517 over the period, more than doubling. This coincided with growing concerns about this cruel and exploitative trade in the US and a major push to open up Victoria to the commercial exploitation of Kangaroos and a major marketing effort, which went around the globe, claiming that there were two Kangaroos for every Australian and the pest marketing spin began in earnest.

The problem was that the claims about increasing population numbers are biologically impossible therefore there was zero probability that the claim was correct.
We can ask ourselves how a national government could allow this and even fund projects to help the exploitation?
With all the pressure the Victorian Government opened up Victoria to commercial Kangaroo shooters in 2014, initially as a trial. Off a low population base and despite targeting a staggering 2,079,461 Kangaroos (plus joeys) since 2014, the Victorian Government continues to claim that Kangaroo populations in the state are ‘flourishing’. We should note that the Kangaroo population estimate for Victoria in 2024 on which the 2025 quotas are based was 2,078,000.
From some very shaky figures we have for Victoria regarding the state’s Kangaroo pet food trial (KPFT) in the years 2014-2018, it appears the environment department authorised the killing of around 390,886 Kangaroos for commercial gain. It might also be that Red Kangaroos were included in the slaughter. This number is not included in the master table below.
Changes to survey methodology / design are an example of why population estimates for Kangaroos can rise at an impossible rate, for example, in 1984, the NSW NPWS decided to change the structure of the aerial survey from monitor blocks to a long line method because of concerns regarding accuracy of the aerial count.
The most extreme exaggerations of population estimates have occurred in Queensland and these distort the all Australia population estimate to such an extent that has enabled the claims and marketing campaigns of booming populations, "even destroying, to quote Australia’s national broadcaster, the ABC, the environment in which they evolved".
As of 15 May 2025 three states had reported their actual commercial take for 2024. Of the five shooting states on mainland Australia, the last to report was South Australia on 11 June. Our regional forecast for actual take for the Australian mainland was revised to 1,305,522. The 2024 quota was 4,979,257. The actual take as reported by all 5 governments is 1,316,573. The actual take was below our original forecast in Queensland and above original forecast, marginally in South Australia, Victoria and Western Australia and more significantly in New South Wales. The net difference from our forecast and actuals reported is is 11,051 additional animals. What is shocking is the shortfall in quota, that at just 26.4 per cent of the mainland Australia quota or 3,662,684 less Kangaroos than the mainland quota for 2024. This tells us that the animals they are trying to kill DO NOT EXIST. Here is the detail.
For these four states we estimate that an additional 400,000 joeys were beaten to death or decapitated, these animals are not included in the annual commercial data.
Figure 1 tracks population estimates for species of Kangaroo (and Wallaby) exploited commercially by state (excludes Tasmania as the state does not report its commercial data in the same way and escapes scrutiny) and all Australia between 1981 and 2025. The graph describes the wildly impossible population increases which are most marked in Queensland and on which fantasy population booms are reported widely in Australian media (the ABC is the most egregious promoters of this myth). In the early period, New South Wales and Queensland appear to have fairly similar population estimates and a rapid divergence occurs in the late 1990s. Despite the endless propaganda to the contrary, Western Australia and South Australia appear on the graph as having fairly stable population estimates.
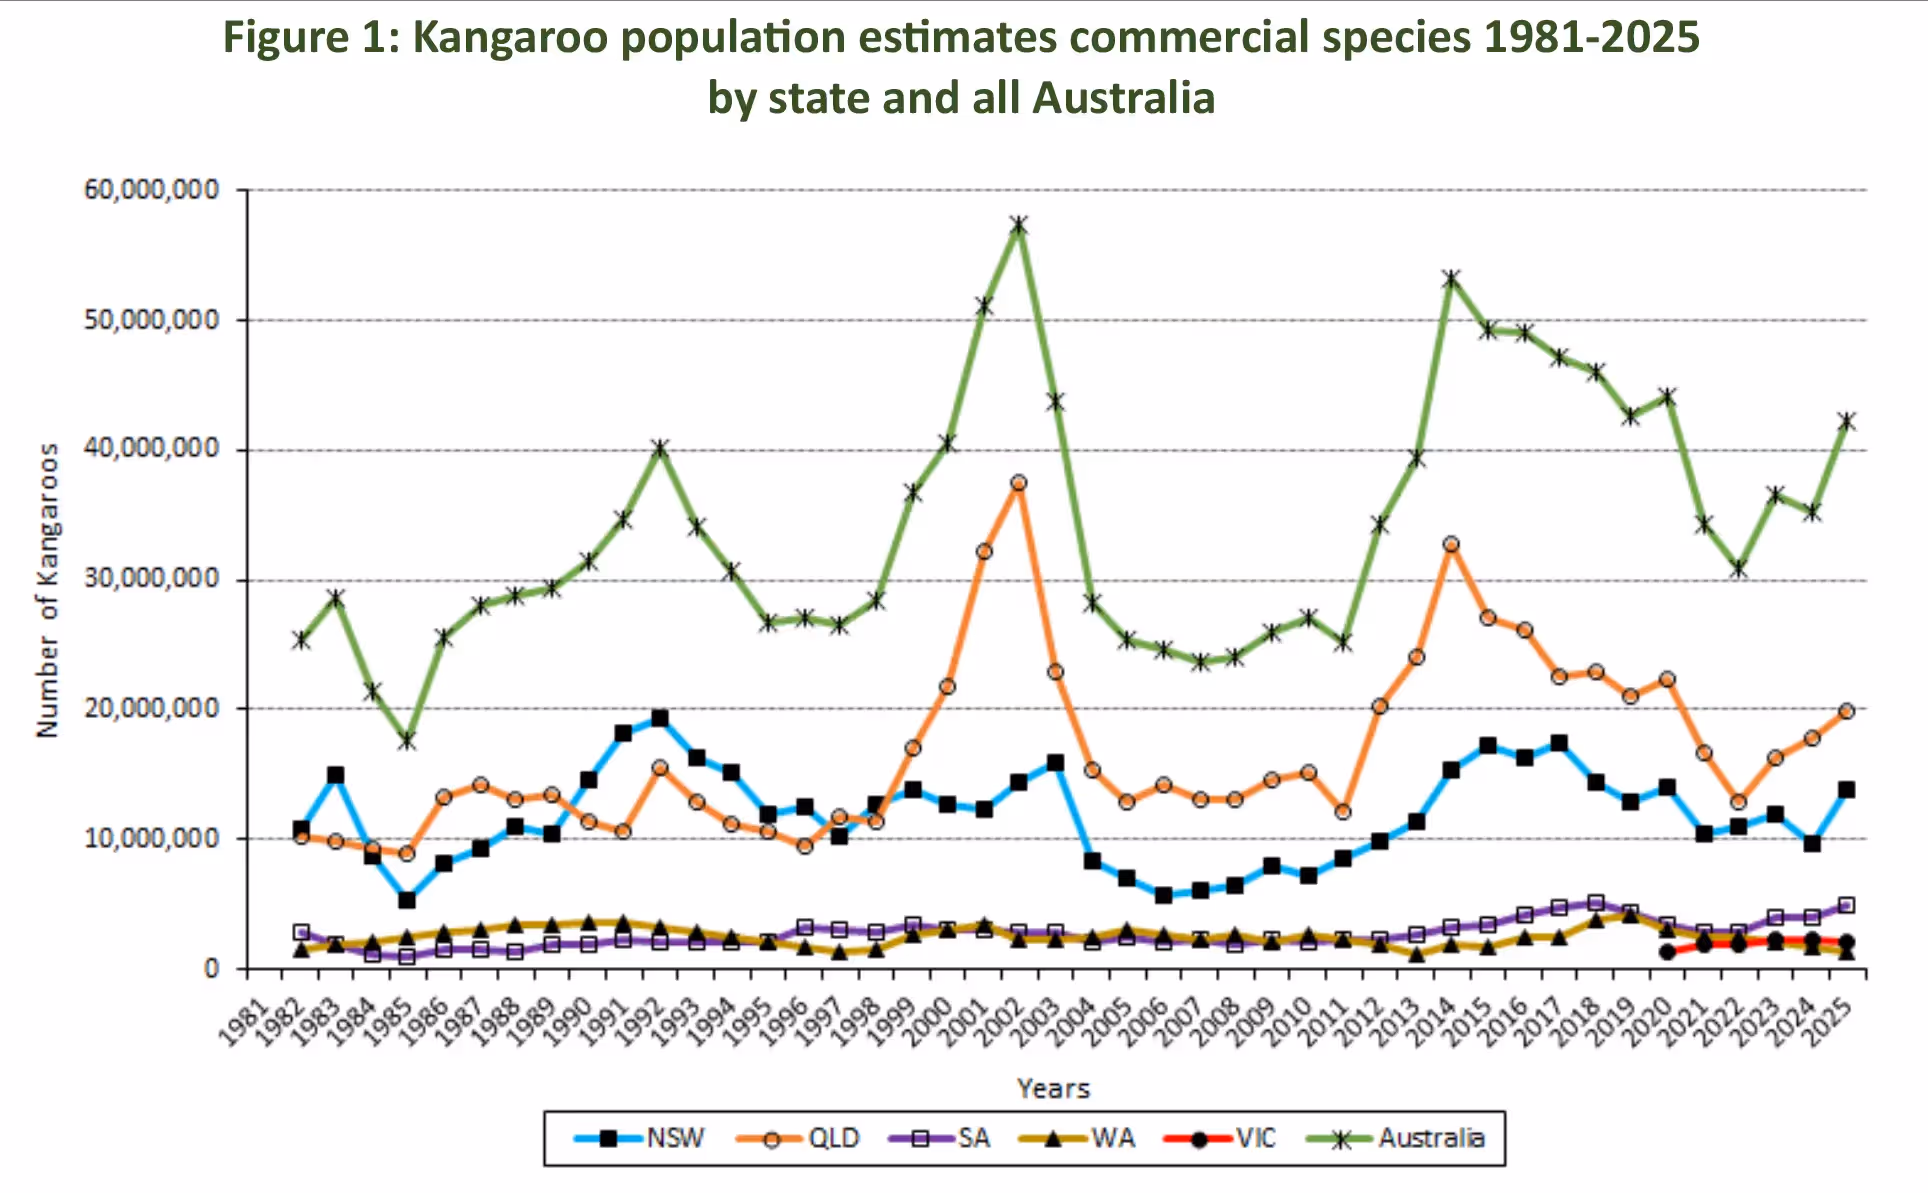
Figure 2 measures the actual take as a share of the quota (red line) for the Australian mainland and describes a steady decline in take, indicating that Australia’s population estimates are far too high and hence the animals being targeted do not exist so can’t be killed for commercial gain.
The green line shows the mainland actual take as a share of the population estimate, again decline is evident from around 2006, despite shooting zone extensions, shooting more female Kangaroos, adding new species to the commercial list, adding all Victoria as initially 7 shooting zones and opening public lands, including National Parks, to the commercial exploitation of Kangaroos. These elements are an indicator of actual and serial decline of Kangaroo populations because over exploitation for both commercial gain and mitigation. Even vast scale extensions of what and where animals can be shot has not halted the long term decline, reprieves are short lived.
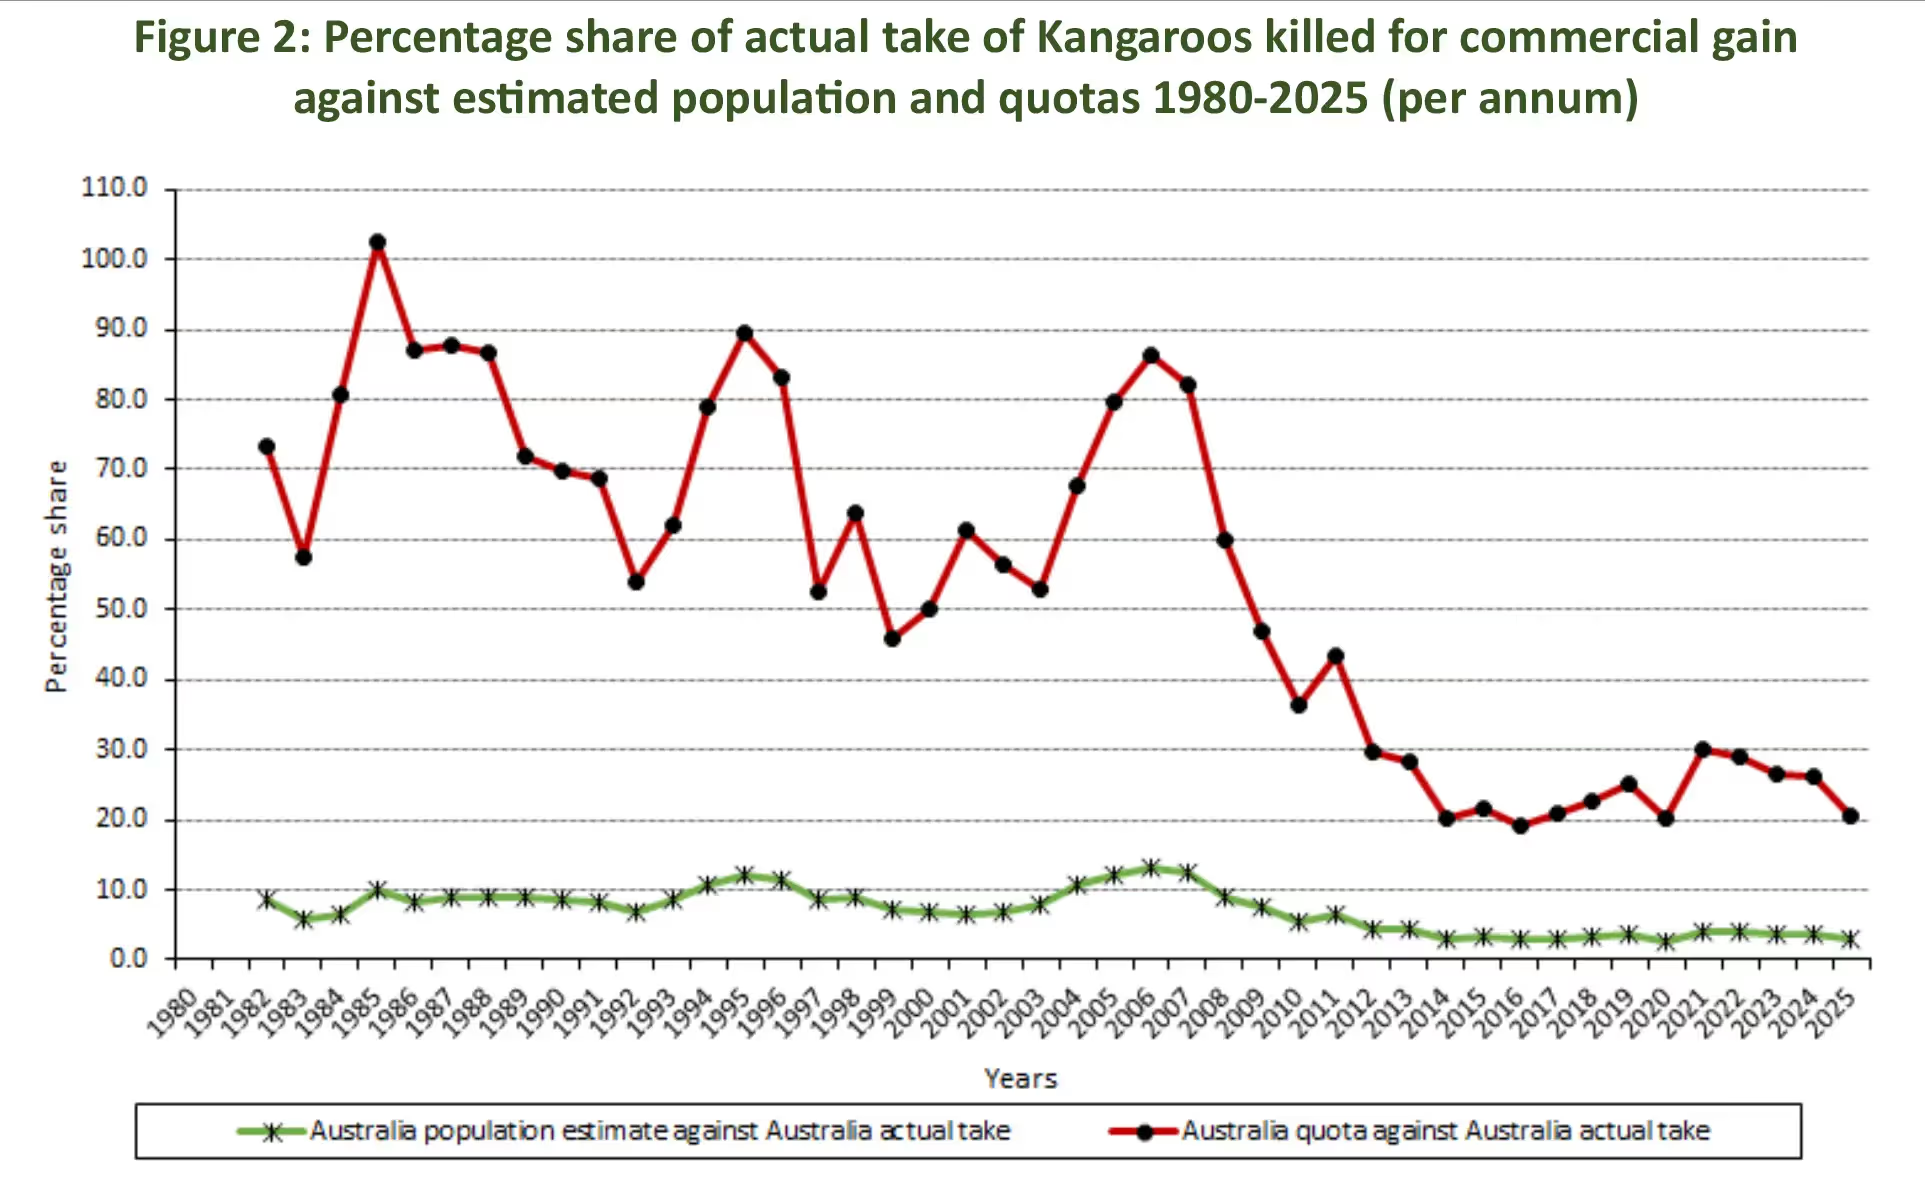
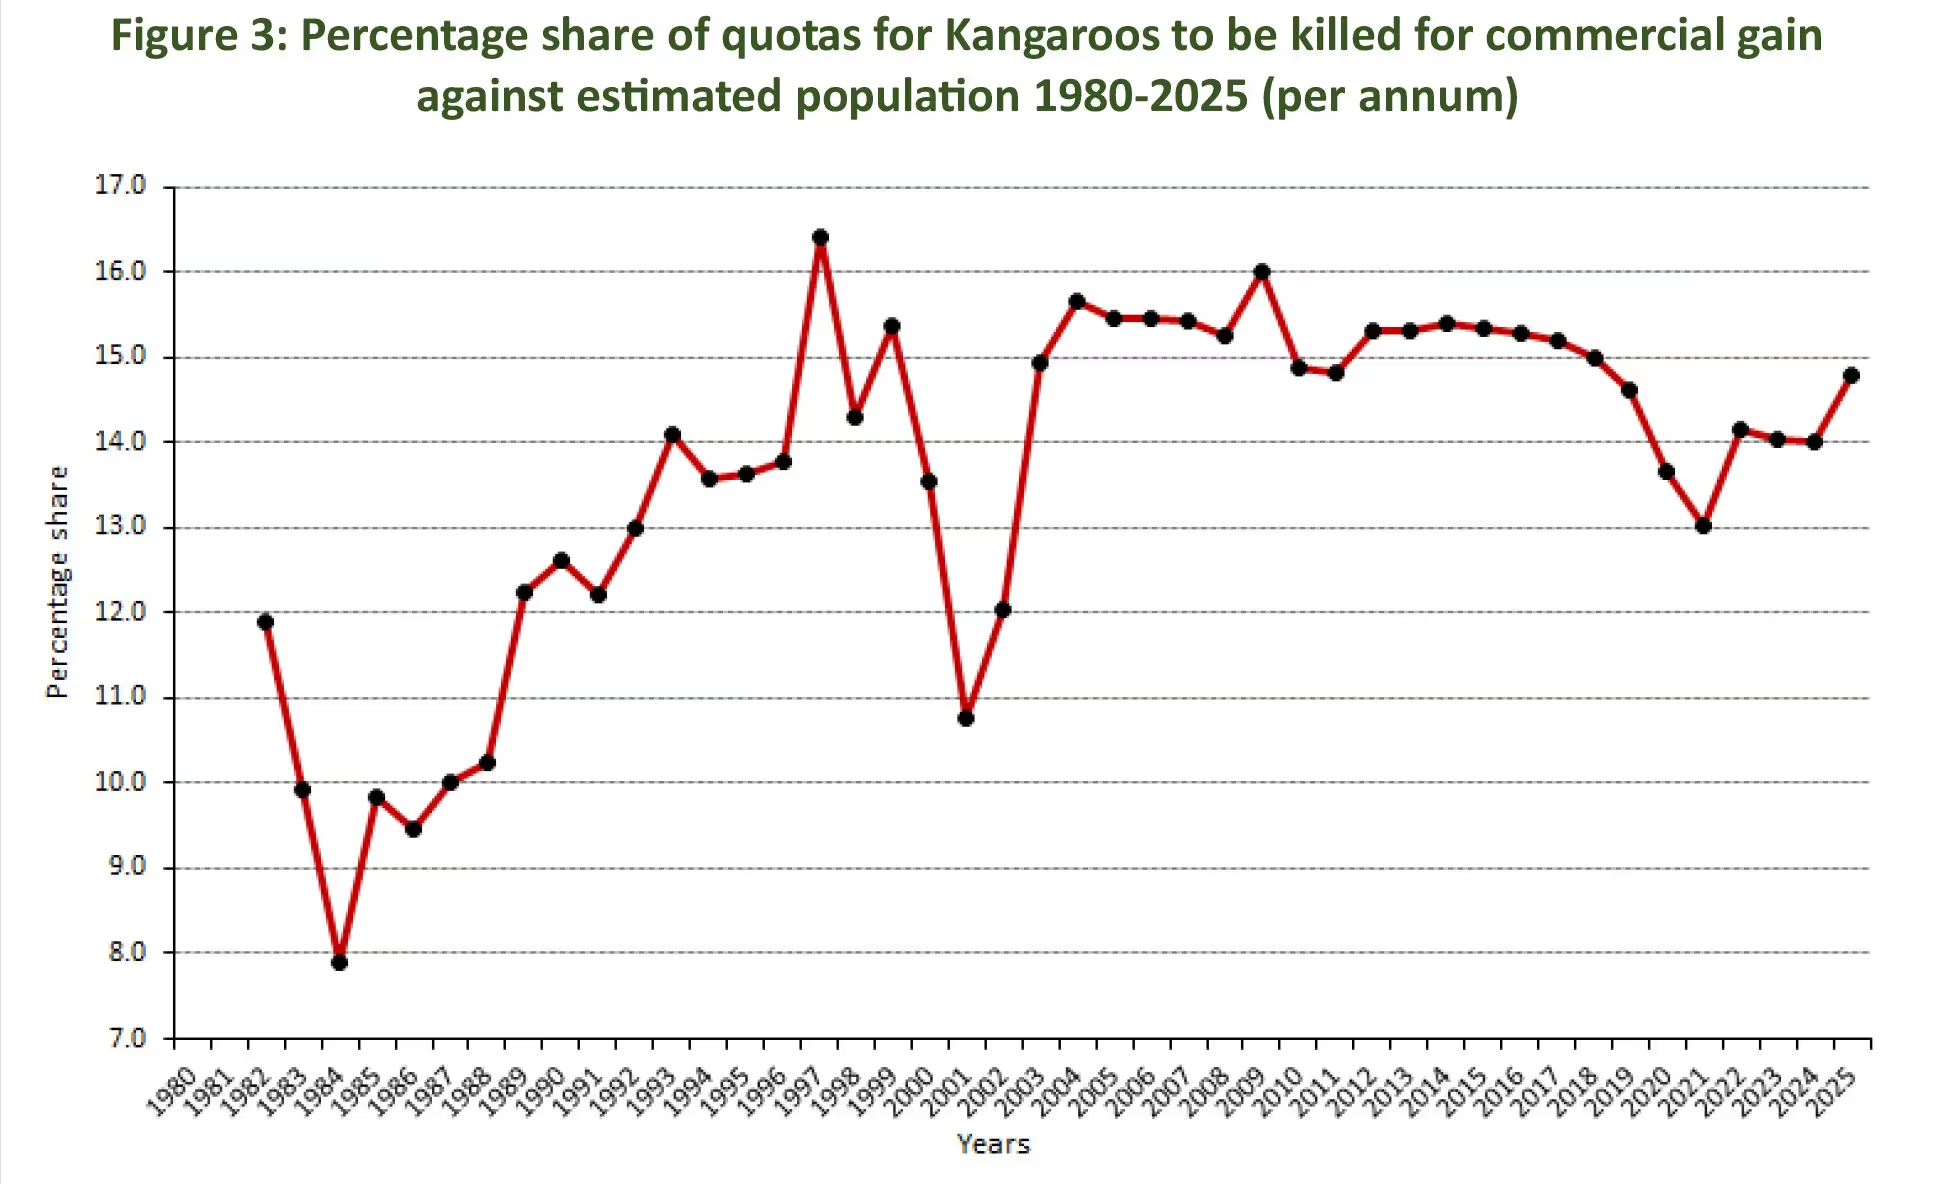
Figure 3 gives percentage of commercial quota as a share of estimated population. Given that population estimates are already far too high, a consequence of this is over exploitation and a high probability that the proportion of the remaining Kangaroo population being targeted for commercial gain will be far higher than the graph indicates. This means that the current level of exploitation is not sustainable as governments claim.
The first of two tables below gives the population estimates for commercially exploited Kangaroo and Wallaby species in shooting zones by state and all Australia mainland and quotas and actual take for all Australia mainland for the period 1980-2025. Population estimates prior to 2002, which were removed from the public gaze around 15 years ago are shown in this table. The table describes wild swings in Kangaroo population estimates which are biologically impossible. That means IMPOSSIBLE.
For example, Queensland, in the years 2000-2001 claimed an increase in the population estimate of 10,360,000 on a base of 21,750,000 when the maximum increase possible in the best of circumstances was 2,000,000 increase without the mass killing, so at least a fivefold exaggeration.
Even more bizarre, between the years 1998-2002 the claim from the Queensland Government was that the Kangaroo population increased from 11,320,000 to 37,574,300. That is more than tripling in the period, then falling in the next year back to 22,856,128.
Despite the claims populations fall during drought conditions, something else is going on here and is likely to do more with methodology and what is on someone’s computer than it is to what has actually occurred on the land. The table is full of these impossibilities and has allowed for the claims of booming populations, which are of course impossible.
This becomes obvious when we track the fall in actual take as Kangaroos vanish from Australian landscapes, so in 2002 the actual commercial take for all mainland Australia was 3,898,716, falling to, despite the several expansions, to 1,316,573 Kangaroos by 2024. The divergence between quota and actual take continues to expand, off a low base the only time in the last 45 years the quota was met was in 1985 and by 2025 we estimate the shortfall against quota will be 4,942,792, that is just 20.7 per cent of quota will be met.
So there are no ceilings or barriers to what can be killed, and increasingly where it can be killed.
The second table gives the data for the commercial exploitation of Kangaroos in Australia by mainland Australian state in the period 2020-2025. The table shows the significant shortfall in actual take against quota in each and every state and is an indicator of how inaccurate state population estimates actually are. South Australia comes out worst on this measure, with actual take in 2025 estimated to be just 11.7 per cent (it was 17 per cent in 2024, but off a much smaller quota). We should note that the percentage of actual take increases mainly because the quota is lower in a given year. For example, the 2021 quota for Australia was 1,524,085 lower than the quota in 2020. What was particularly shocking was that for the quota alone, the reduction in the quota between those years was higher than the actual annual take in each year.
As we said above, even vast scale extensions of what and where animals can be shot, particularly since 2019, has not halted the long term decline, reprieves are short lived. If those extensions had not occurred, the actual commercial take against quota for all mainland Australia would be less than 1,000,000, that is just 16 per cent of the Australian mainland quota for 2025. The recent announcements from state governments that killing would be fast tracked and further supported, particularly so in South Australia and Victoria, will mean that, in the future actual take against quota will be lower still, and all this while they continue to spin the story of booming populations.

In 2024, the New South Wales Government claim an increase in Kangaroo populations that is impossible. This population estimate sets the quota for 2025.
As per usual, Queensland is the first to publish it latest Kangaroo population estimates and commercial quotas. Here they are.
Given the up and coming Kangaroo Inquiry in South Australia this analysis will be useful to submitters trying to understand what is occurring.
Population estimates (2024) and quotas (2025) for the Eastern and Western Grey Kangaroos were published on 22 December 2024.
Population estimates and commercial quotas for the exploitation of Kangaroos in Western Australian were available in early April 2025. The population estimates for both the Western Grey and Red Kangaroo show decline hence quotas have also declined.
Professor Steve Garlick (NSW) makes the point that someone always has to clean up the mess resulting from government wildlife polices, the someone is a wildlife carer.
This analysis summarises the 2024 population estimates for Kangaroos on the Australian mainland and the resulting commercial quotas in 2025.
This analysis details the number of ATCWs issued in Victoria in 2024 by species and number of animals targeted. It shows a significant increase in the number of protected wildlife being killed using this permit.